
Selling out all tickets doesn't guarantee event success. A sold-out show with 40% no-shows, zero audience data, and no repeat buyers is a mediocre event by the numbers.
In this guide, you'll find the essential KPIs to measure event success before, during, and after. Includes formulas, a ready-to-copy template, and common mistakes to avoid. All based on industry-standard metrics.
Quick Decision: 5 Minimum KPIs Every Organizer Should Track
If you don't have time to read everything, start measuring these five indicators. They separate organizers who operate blindly from those who make data-driven decisions:
Actual attendance rate: What percentage of sold tickets converted to people present? Formula: (check-ins / tickets sold) × 100.
Sales velocity: How many days did it take to sell 50% of tickets? Shows if your launch strategy works or if you depend on last-minute urgency.
NPS (Net Promoter Score): Would your attendees recommend your event? Formula: % promoters (9-10) − % detractors (0-6). Range: −100 to +100.
Repeat purchase rate: What percentage of attendees bought tickets to your next event? The most direct indicator that the experience worked.
Owned database growth: How many new contacts did you add to your database? Without your own database, every event starts from zero.cómo usar los datos de compradores para vender más
What "Event Success" Means (and Why It's Not Synonymous with Sold Out)
A sold-out show is a sales result, not a business outcome. An event can sell out tickets and fail if it didn't achieve any strategic objectives. Measuring event success requires first defining what you were trying to accomplish.
Three types of objectives define event success beyond revenue:
Brand: position your event as a leader. Measured by reach, mentions, and NPS.
Audience: build your own database. Measured by new contacts and opt-in rate.
Retention: get attendees to return. Measured by repeat purchase rate and attendance frequency.
Pre-Event KPIs: Demand and Sales Efficiency
Pre-show event metrics tell you if your communication and pricing strategy is working.
Sales velocity. Measure how many days it took to sell 25%, 50%, and 75% of tickets. If 80% sells in the last 48 hours, you're depending on urgency, not genuine demand.
Site conversion rate. Ratio between visitors and buyers: (purchases / unique visits) × 100. A low rate with high traffic suggests friction in the purchase process.
Channel distribution. What percentage of sales comes from social media, email, organic search, or direct traffic? Using UTM parameters on every link lets you attribute each purchase to its source channel.estrategias de marketing para eventos
Average ticket price. Average value per transaction. Indicates if your category structure works or if everyone buys the cheapest option.
Event Day KPIs: Attendance and Experience
Event day is where you measure the actual experience, not purchase intent.
Attendance rate. The most important metric of the day. (Validated check-ins / tickets sold) × 100. An event with 30% no-shows has an engagement or sales channel problem.
Peak entry time. What time did the most people arrive? Key for scheduling artists, defining door opening times, and sizing staff.
CSAT (Customer Satisfaction Score). Simple survey: "Rate your experience from 1 to 5." More direct than NPS for capturing immediate satisfaction.
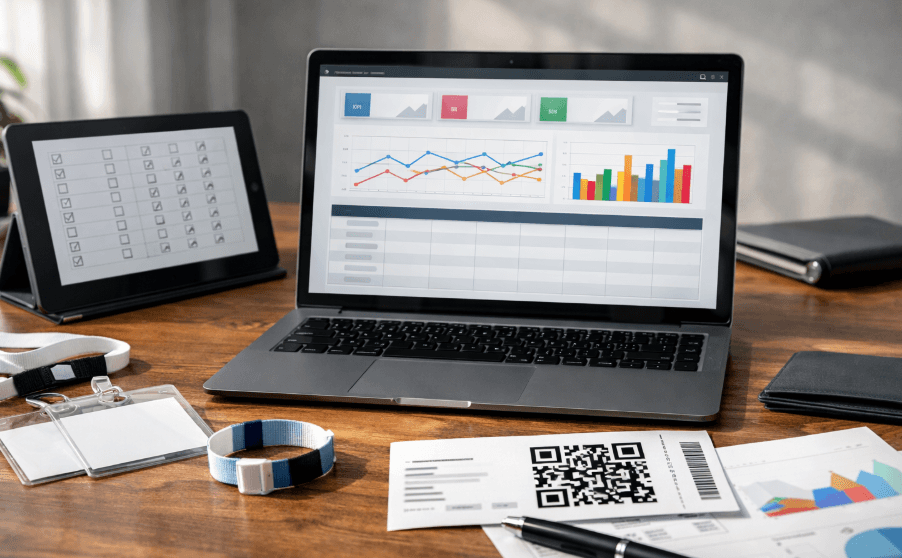
QR code validation is the standard method for recording check-ins. Platforms like Fanz allow ticket validation with QR from any camera-enabled device, generating real-time attendance data.
Post-Event KPIs: Retention, Reputation, and Owned Database
Post-event is where real impact is measured. Many organizers stop measuring when the show ends.
NPS (Net Promoter Score). Send a survey 24-48 hours after: "From 0 to 10, would you recommend this event?" NPS above +50 is excellent. Below +20, there's work to do.
Repeat purchase rate. (Attendees who buy for the next event / total attendees from previous) × 100. The definitive indicator that the experience generated value.
Net database growth. How many new contacts with verified email did you add? Without your own database, every event requires starting communication from scratch.
Post-event email open rate. If you send communications after the show, measure what percentage opens them. Indicates real audience engagement.
For these KPIs to be actionable, your buyer data must be in your own database. White-label ticketing platforms like Fanz allow operating with your own domain and branding, retaining ownership of each buyer's data for email campaigns and remarketingplataforma de ticketing marca blanca (Source: fanz.com.ar).
KPI Template: Ready to Copy
Stage | KPI | Formula / Method | Action if result is low |
|---|---|---|---|
Before | Sales velocity | Days until 50% of tickets sold | Review launch timing and distribution channels |
Before | Site conversion | (Purchases / unique visits) × 100 | Optimize purchase flow and reduce steps |
Before | Channel distribution | % sales per source (UTM) | Reallocate budget to highest-converting channel |
Before | Average ticket price | Total revenue / number of transactions | Review category structure |
During | Attendance rate | (Check-ins / tickets sold) × 100 | Investigate channels with high no-show |
During | Peak entry time | Time with most check-ins | Adjust programming and door opening |
During | CSAT | Average of 1-5 responses | Identify experience weak points |
After | NPS | % promoters − % detractors | Act on detractor feedback |
After | Repeat purchase rate | (Repeat buyers / total attendees) × 100 | Improve experience or post-event communication |
After | Database growth | New contacts with verified email | Review if you're capturing data in purchase flow |
After | Email open rate | (Emails opened / emails sent) × 100 | Improve subjects, timing, and segmentation |
How to Measure: Practical Tools and Methods
UTM parameters. Add UTM tags to every sales link. Format: ?utm_source=instagram&utm_medium=stories&utm_campaign=march_event. This way you know where each purchase came from.
Post-event surveys. Send a brief survey (3-5 questions) within 24-48 hours. Always include NPS and an open question. Google Forms or Typeform are sufficient.
QR code check-in. QR ticket validation to record actual attendance: exact rate, peak time, and cross-reference purchase/presence data.
Analytics dashboard. Review sales site metrics (visits, conversion, abandonment). If you operate with processors like Stripe, Apple Pay, or ACH, you can cross-reference payment data with attendance.
Minimum measurement checklist:
☐ UTMs configured on all sales links
☐ QR ticket validation active
☐ NPS survey scheduled for 24-48hrs post-event
☐ Exportable buyer database
☐ Sales report by channel available
☐ Check-in metrics recorded
☐ Post-event email with CSAT/NPS survey ready
Common Mistakes Measuring Event Success
Only measuring revenue. Money that came in is data, not a diagnosis. Without context (attendance, NPS, repeat purchases), you don't know if that income is repeatable.
Not measuring no-shows. If you sold 1,000 tickets and 600 attended, you have 40% absenteeism. This impacts experience, operational costs, and perception.
Sending surveys too late. After 72 hours, response rate drops drastically. Send within 24-48 hours.
Not tagging links with UTM. Without UTMs, you can't know which channel generated each sale. You invest in advertising without knowing what works.
Confusing followers with attendees. Many social media followers doesn't equal sales. Measure real conversion, not vanity metrics.
Not building your own database. If buyer data stays on a third-party platform, you can't do remarketing or communicate directly for the next event.
Use Cases: Measurement by Event Type
Major festival (+5,000 people)
Priority KPIs: attendance rate per day, channel distribution, peak entry time, NPS by artist. Volume allows identifying patterns and optimizing future editions.
Theater or venue with recurring shows
Priority KPIs: repeat purchase rate between shows, occupancy per show, CSAT per production, subscriber base growth. Recurrence allows comparing show to show.
Corporate event or conference
Priority KPIs: actual attendance vs. registered, NPS, leads generated, content and networking survey. Success is measured by perceived value, not quantity.
Sporting event or competition
Priority KPIs: attendance rate, geographic audience distribution, repeat purchases between editions, and social media engagement. Geographic data is key for sponsor negotiations.
Frequently Asked Questions
What's the most important KPI for measuring event success? Depends on the objective. Retention → repeat purchase rate. Reputation → NPS. Operational efficiency → attendance rate. There's no universal KPI.
What's a good attendance rate? Above 80% is considered healthy. Below 70%, there's an engagement or sales channel problem.
How is NPS calculated? "From 0 to 10, would you recommend this event?" Promoters (9-10) minus detractors (0-6), expressed as percentage. Range: −100 to +100.
When to send the post-event survey? Within 24-48 hours. Later, response rate drops significantly.
What are UTM parameters? Tags added to URLs to identify the source of each visit and purchase. They allow attributing sales to specific channels.
Is selling out a good success indicator? It's a demand indicator, not comprehensive success. A sold-out event with high absenteeism and low NPS isn't successful in business terms.
How do I measure repeat purchase rate? You need your own database with history. Formula: (attendees who buy for next event / total attendees from previous) × 100.
What's the difference between CSAT and NPS? CSAT measures immediate satisfaction (1-5 scale). NPS measures recommendation intent (0-10 scale). They're complementary.
How many questions should my survey have? Between 3-5. Always include NPS, general satisfaction, and an open question. More than 5 reduces response rate.
Can I measure without expensive tools? Yes. UTMs are free, Google Forms is free, and QR validation is standard in most ticketing platforms.
Why is having your own database important? Without it you can't do remarketing or segmentation. Every event starts from zero if you depend on a third party's database.
How often should I review these metrics? After each event. Compare KPIs event to event. Review pre-sales weekly during the sales period.
Conclusion
Measuring event success isn't about looking at revenue and moving to the next show. It's about building a system that tells you what worked, what didn't, and what to improve.
Before: sales velocity, conversion, channel distribution.
During: attendance rate, peak time, CSAT.
After: NPS, repeat purchase rate, owned database growth.
The organizer who measures with data doesn't depend on luck. They optimize each edition and build lasting audience relationships. Start with the five minimum KPIs. The difference between a mediocre event and a successful one is often in the numbers you didn't measure.
Tags